BaseFit case study: electrifying an urban fleet does not start with buying vans
14 May 2026
On paper, this fleet looks straightforward to electrify: urban routes, reasonable daily mileage, one depot and an eight-hour overnight charging window.
Once the data are combined, the conclusion changes. Ten routes have at least one credible electric fit, but the depot should begin with six vehicles. The constraint is not one isolated number. It appears at the intersection of route energy, vehicle type, available power, chargers and resilience on difficult days.
This case uses simulated data designed to resemble a real urban and peri-urban delivery operation. The calculations were produced with Autonality’s BaseFit and Route Energy engine.
The case and the business question
The simulated company operates 18 diesel vehicles from a depot near Zaragoza. Its work includes city-centre delivery, pharmacy, HoReCa, light parcels, locker replenishment, urgent spare parts and high-value regional routes.
The company does not want to replace the entire fleet at once. It wants clear answers to six questions:
- which routes have a strong electric fit;
- which vehicle suits each route family;
- whether the depot can recover the required energy overnight;
- how many EVs can be added without major electrical work;
- which routes should wait or be redesigned;
- what happens in cold weather, under higher payload or with one charger unavailable.
The useful question is not “can we buy six electric vans?”. It is which six vans, for which six routes and under which operating rules.
The depot: four chargers do not mean unlimited capacity
The site has 95 kW of contracted power. After reserving 32 kW for the building’s own loads, 63 kW remain for vehicle charging.
| Parameter | Value used |
|---|---|
| Contracted power | 95 kW |
| Site base load | 32 kW |
| Power available for charging | 63 kW |
| Existing chargers | 4 × 22 kW AC |
| Charging window | 21:30–05:30 |
| Effective duration | 8 h |
| Charger utilisation | 82% |
| Charging efficiency | 90% |
| Deliverable overnight energy | 453.6 kWh |
Four 22 kW units add up to 88 kW nominally, but the fleet cannot use all of that power simultaneously. Net site power, charging efficiency, the overnight window and real utilisation set the effective limit.
For a first deployment, this is a reasonable starting point. The problem appears when the fleet tries to scale without knowing where the next bottleneck sits.
Conservative operating assumptions
| Assumption | Value |
|---|---|
| Analysis horizon | 5 years |
| Route buffer | 15% |
| Annual battery degradation | 2.5% |
| Winter penalty | 12% |
| Minimum green margin | 25 km |
| Minimum yellow margin | 5 km |
| Opportunity charging allowed | yes |
The model does not treat new-vehicle range as a permanent constant. It reserves margin, includes battery degradation and tests more demanding conditions.
Twelve route families, not twelve average distances
Routes are grouped using median and P90 distance, stop count, schedules, payload, occupancy, average speed, urban-motorway mix, elevation and temperature.
Two 120 km routes can have very different energy demand and risk. That is exactly the distinction lost when an assessment relies only on average mileage.
| Route | Family | Days/week | Departure | Return | Median km | P90 km | P90 stops | Payload | Occupancy % | Speed km/h | Urban % | Motorway % | Elevation +m | Temp ºC |
|---|---|---|---|---|---|---|---|---|---|---|---|---|---|---|
| R01 | R01 Dense city centre | 6 | 06:35 | 14:10 | 58 | 76 | 104 | low | 35 | 18 | 96 | 0 | 160 | 12 |
| R02 | R02 Pharmacy and temperature-controlled | 6 | 06:20 | 13:50 | 74 | 92 | 61 | medium | 55 | 22 | 88 | 4 | 210 | 8 |
| R03 | R03 Northern industrial area | 5 | 07:05 | 15:20 | 96 | 123 | 49 | medium | 60 | 31 | 58 | 18 | 280 | 12 |
| R04 | R04 Urgent spare parts west | 6 | 08:00 | 17:35 | 128 | 164 | 46 | medium | 52 | 39 | 45 | 28 | 420 | 13 |
| R05 | R05 City-centre HoReCa food delivery | 6 | 06:10 | 15:10 | 83 | 112 | 74 | high | 78 | 20 | 90 | 2 | 240 | 10 |
| R06 | R06 Light parcels outskirts | 6 | 07:20 | 14:40 | 102 | 132 | 96 | medium | 48 | 28 | 72 | 12 | 300 | 14 |
| R07 | R07 Mixed regional route east | 5 | 06:50 | 16:45 | 156 | 198 | 42 | medium | 58 | 46 | 35 | 38 | 620 | 11 |
| R08 | R08 High-volume retail | 5 | 07:35 | 16:20 | 118 | 154 | 31 | high | 82 | 34 | 50 | 22 | 360 | 12 |
| R09 | R09 Locker and OOH point replenishment | 6 | 09:10 | 18:30 | 142 | 178 | 55 | medium | 62 | 32 | 62 | 18 | 390 | 14 |
| R10 | R10 Returns and second wave | 5 | 11:45 | 20:15 | 88 | 118 | 62 | medium | 50 | 24 | 78 | 8 | 250 | 15 |
| R11 | R11 Long regional high-value route | 4 | 06:30 | 18:40 | 188 | 236 | 25 | medium | 55 | 52 | 25 | 48 | 850 | 10 |
| R12 | R12 Heavy refrigerated peri-urban route | 5 | 05:55 | 15:55 | 134 | 172 | 43 | high | 86 | 33 | 55 | 24 | 520 | 7 |
Six candidate vehicles with different constraints
Each candidate provides a different combination of usable battery, AC and DC charging power, payload, cargo volume and baseline consumption.
| Candidate vehicle | Segment | Usable battery kWh | AC kW | DC kW | Payload kg | Volume m³ | Baseline consumption Wh/km |
|---|---|---|---|---|---|---|---|
| Peugeot E-Partner Long 800kg electric 100 kW (136 hp) | small-van | 50 | 11 | 100 | 559 | 4.4 | 215 |
| Renault Trafic Van E-Tech L1H1 52kWh | midsize-van | 52 | 22 | 50 | 1222 | 5.8 | 235 |
| BaseFit archetype medium refrigerated van 75kWh | midsize-van | 68 | 11 | 100 | 650 | 5.5 | 310 |
| Farizon SV SuperVan L2H2 82.88kWh | large-van | 82.88 | 11 | 140 | 1200 | 9.39 | 240 |
| Farizon SV SuperVan L3H3 106.35kWh | large-van | 106.35 | 11 | 120 | 1075 | 13 | 267 |
| Ford E-Transit 425 L3H2 Extended Range | large-van | 89 | 11 | 180 | 1429 | 13 | 330 |
The vehicles in the table are analysis candidates, not a final procurement recommendation. A real decision would also validate the exact variant, body conversion, homologation, final payload, availability, maintenance and warranty.
First result: ten routes fit, but not equally well
The route-to-vehicle assessment produces eight green routes, two yellow routes and two red routes under baseline conditions.
| Route | Family | Best BaseFit candidate | Band | Score | P90 energy kWh | P90 margin km | Adjusted Wh/km |
|---|---|---|---|---|---|---|---|
| R01 | R01 Dense city centre | Peugeot E-Partner Long 800kg electric 100 kW (136 hp) | green | 100 | 33.68 | 25.96 | 290.4 |
| R02 | R02 Pharmacy and temperature-controlled | Farizon SV SuperVan L2H2 82.88kWh | green | 100 | 46.72 | 55.47 | 327.24 |
| R03 | R03 Northern industrial area | Farizon SV SuperVan L2H2 82.88kWh | green | 100 | 50.84 | 58.2 | 284.33 |
| R04 | R04 Urgent spare parts west | Farizon SV SuperVan L3H3 106.35kWh | green | 100 | 71.3 | 57.07 | 306.94 |
| R05 | R05 City-centre HoReCa food delivery | Farizon SV SuperVan L2H2 82.88kWh | green | 100 | 54.07 | 43.15 | 332.87 |
| R06 | R06 Light parcels outskirts | Farizon SV SuperVan L2H2 82.88kWh | green | 100 | 54.63 | 48.97 | 293.22 |
| R07 | R07 Mixed regional route east | Farizon SV SuperVan L3H3 106.35kWh | yellow | 69 | 90.45 | 12.38 | 324.94 |
| R08 | R08 High-volume retail | Farizon SV SuperVan L2H2 82.88kWh | yellow | 72 | 64.5 | 24.83 | 292.48 |
| R09 | R09 Locker and OOH point replenishment | Farizon SV SuperVan L3H3 106.35kWh | green | 100 | 75.87 | 47.48 | 307.8 |
| R10 | R10 Returns and second wave | Farizon SV SuperVan L2H2 82.88kWh | green | 100 | 52.87 | 49.16 | 313.67 |
| R11 | R11 Long regional high-value route | Peugeot E-Partner Long 800kg electric 100 kW (136 hp) | red | 0 | 92.05 | -120.16 | 262.47 |
| R12 | R12 Heavy refrigerated peri-urban route | Peugeot E-Partner Long 800kg electric 100 kW (136 hp) | red | 0 | 74.31 | -67.42 | 274.03 |
The table needs a careful reading:
- Green means a strong fit under the defined assumptions. It does not mean the entire fleet should be electrified tomorrow.
- Yellow means the route can work, but it needs explicit rules on SOC, payload, deviations or backup.
- Red does not disqualify electric vehicles in general. It means that route, as currently designed, is not a sensible first-phase candidate.
The depot selects six routes to start
BaseFit prioritises the six families that best combine operating fit, value and energy demand within the depot’s actual limits.
| Route | Family | Assigned vehicle | Band | P90 kWh | Score |
|---|---|---|---|---|---|
| R01 | R01 Dense city centre | Peugeot E-Partner Long 800kg electric 100 kW (136 hp) | green | 33.68 | 100 |
| R02 | R02 Pharmacy and temperature-controlled | Farizon SV SuperVan L2H2 82.88kWh | green | 46.72 | 100 |
| R03 | R03 Northern industrial area | Farizon SV SuperVan L2H2 82.88kWh | green | 50.84 | 100 |
| R04 | R04 Urgent spare parts west | Farizon SV SuperVan L3H3 106.35kWh | green | 71.3 | 100 |
| R05 | R05 City-centre HoReCa food delivery | Farizon SV SuperVan L2H2 82.88kWh | green | 54.07 | 100 |
| R06 | R06 Light parcels outskirts | Farizon SV SuperVan L2H2 82.88kWh | green | 54.63 | 100 |
| Deployment scenario | Overnight energy |
|---|---|
| First phase: 6 EVs | 311.24 kWh |
| All compatible routes: 10 EVs | 594.93 kWh |
| Deliverable depot capacity | 453.6 kWh |
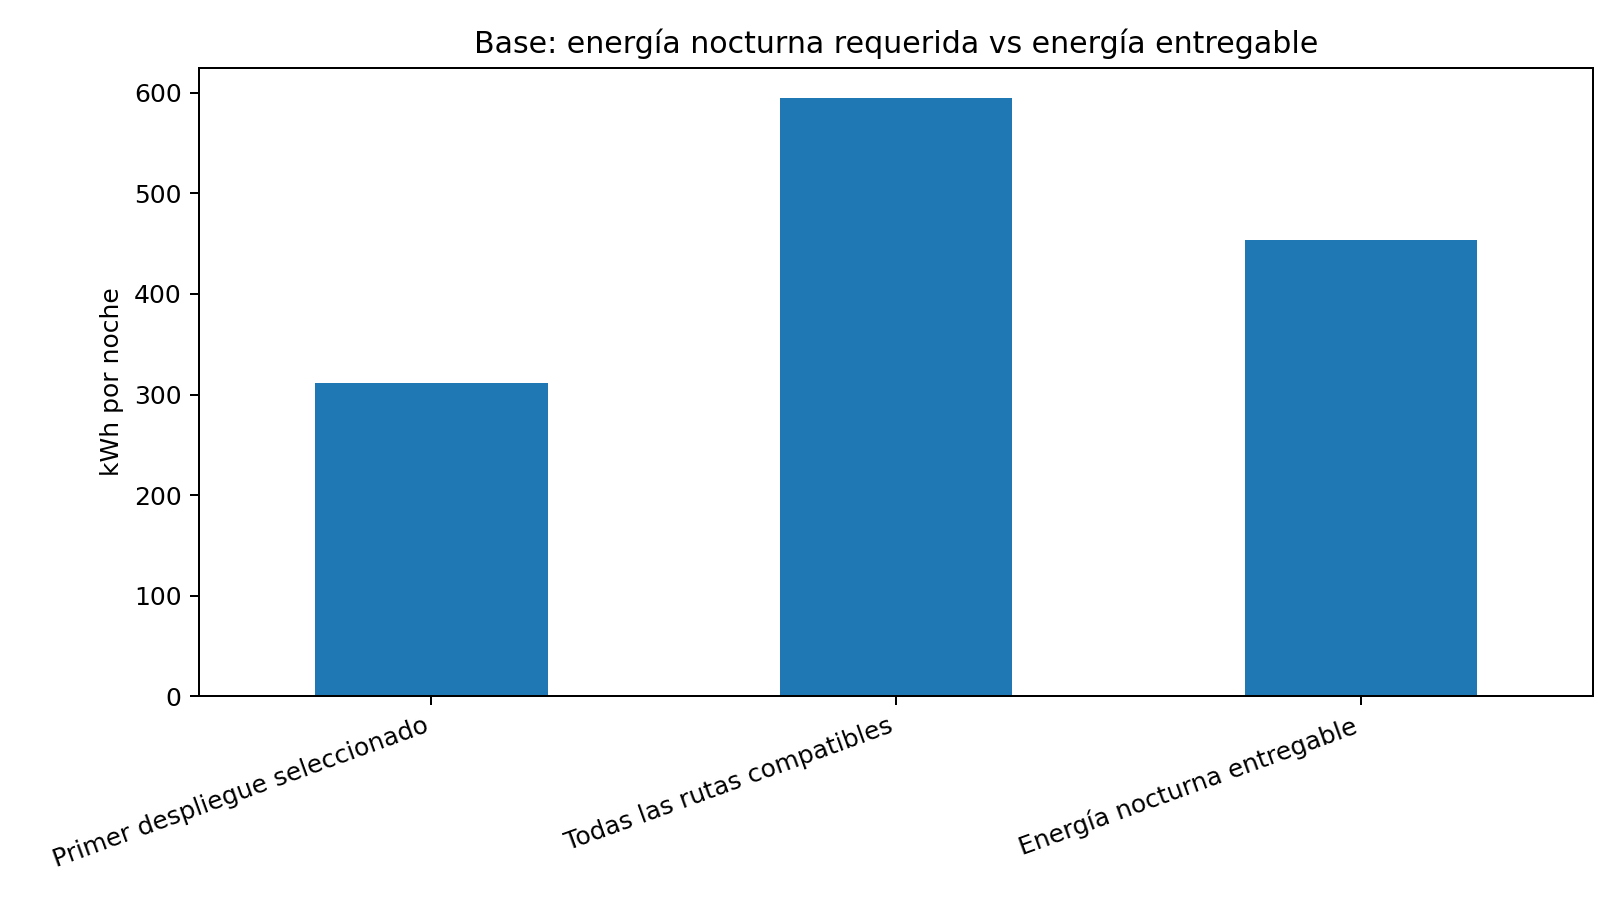
R07, R08, R09 and R10 are not excluded because they are impossible. They are excluded because beginning at the limit would leave too little capacity for delays, winter conditions or charging failures.
The next-phase bottleneck
| Metric | Result |
|---|---|
| Compatible routes | 10 |
| EVs currently supported by the depot | 6 |
| Chargers required for all compatible routes | 7 |
| Existing chargers | 4 |
| Required contracted power | 106.37 kW |
| Current contracted power | 95 kW |
| Power gap | 11.37 kW |
| Energy required for all compatible routes | 594.93 kWh |
| Current deliverable energy | 453.6 kWh |
| Overnight energy gap | 141.33 kWh |
| Main bottleneck | power |
The conclusion is not that the current installation is inadequate. It is adequate for a sensible first phase and becomes inadequate when the fleet tries to electrify the entire compatible block. That distinction tells the company when to invest and which assumptions the pilot needs to validate.
Stress scenarios show where the plan breaks
Operations rarely fail on an average day. They fail when cold weather, higher payload, a longer route, lower efficiency or a charger outage occur together.
| Scenario | Green | Yellow | Red | Viable | Depot bottleneck | EVs supported | Required kWh | Deliverable kWh | Failure |
|---|---|---|---|---|---|---|---|---|---|
| Demanding winter | 5 | 3 | 2 | No | power | 6 | 542.34 | 453.6 | both |
| High payload | 6 | 2 | 2 | No | chargers | 6 | 459.87 | 453.6 | both |
| One charger unavailable | 8 | 2 | 0 | No | power | 4 | 594.93 | 351.65 | depot |
| Winter with stressed operations | 0 | 0 | 10 | No | vehicles | 0 | 0 | 443.52 | route |
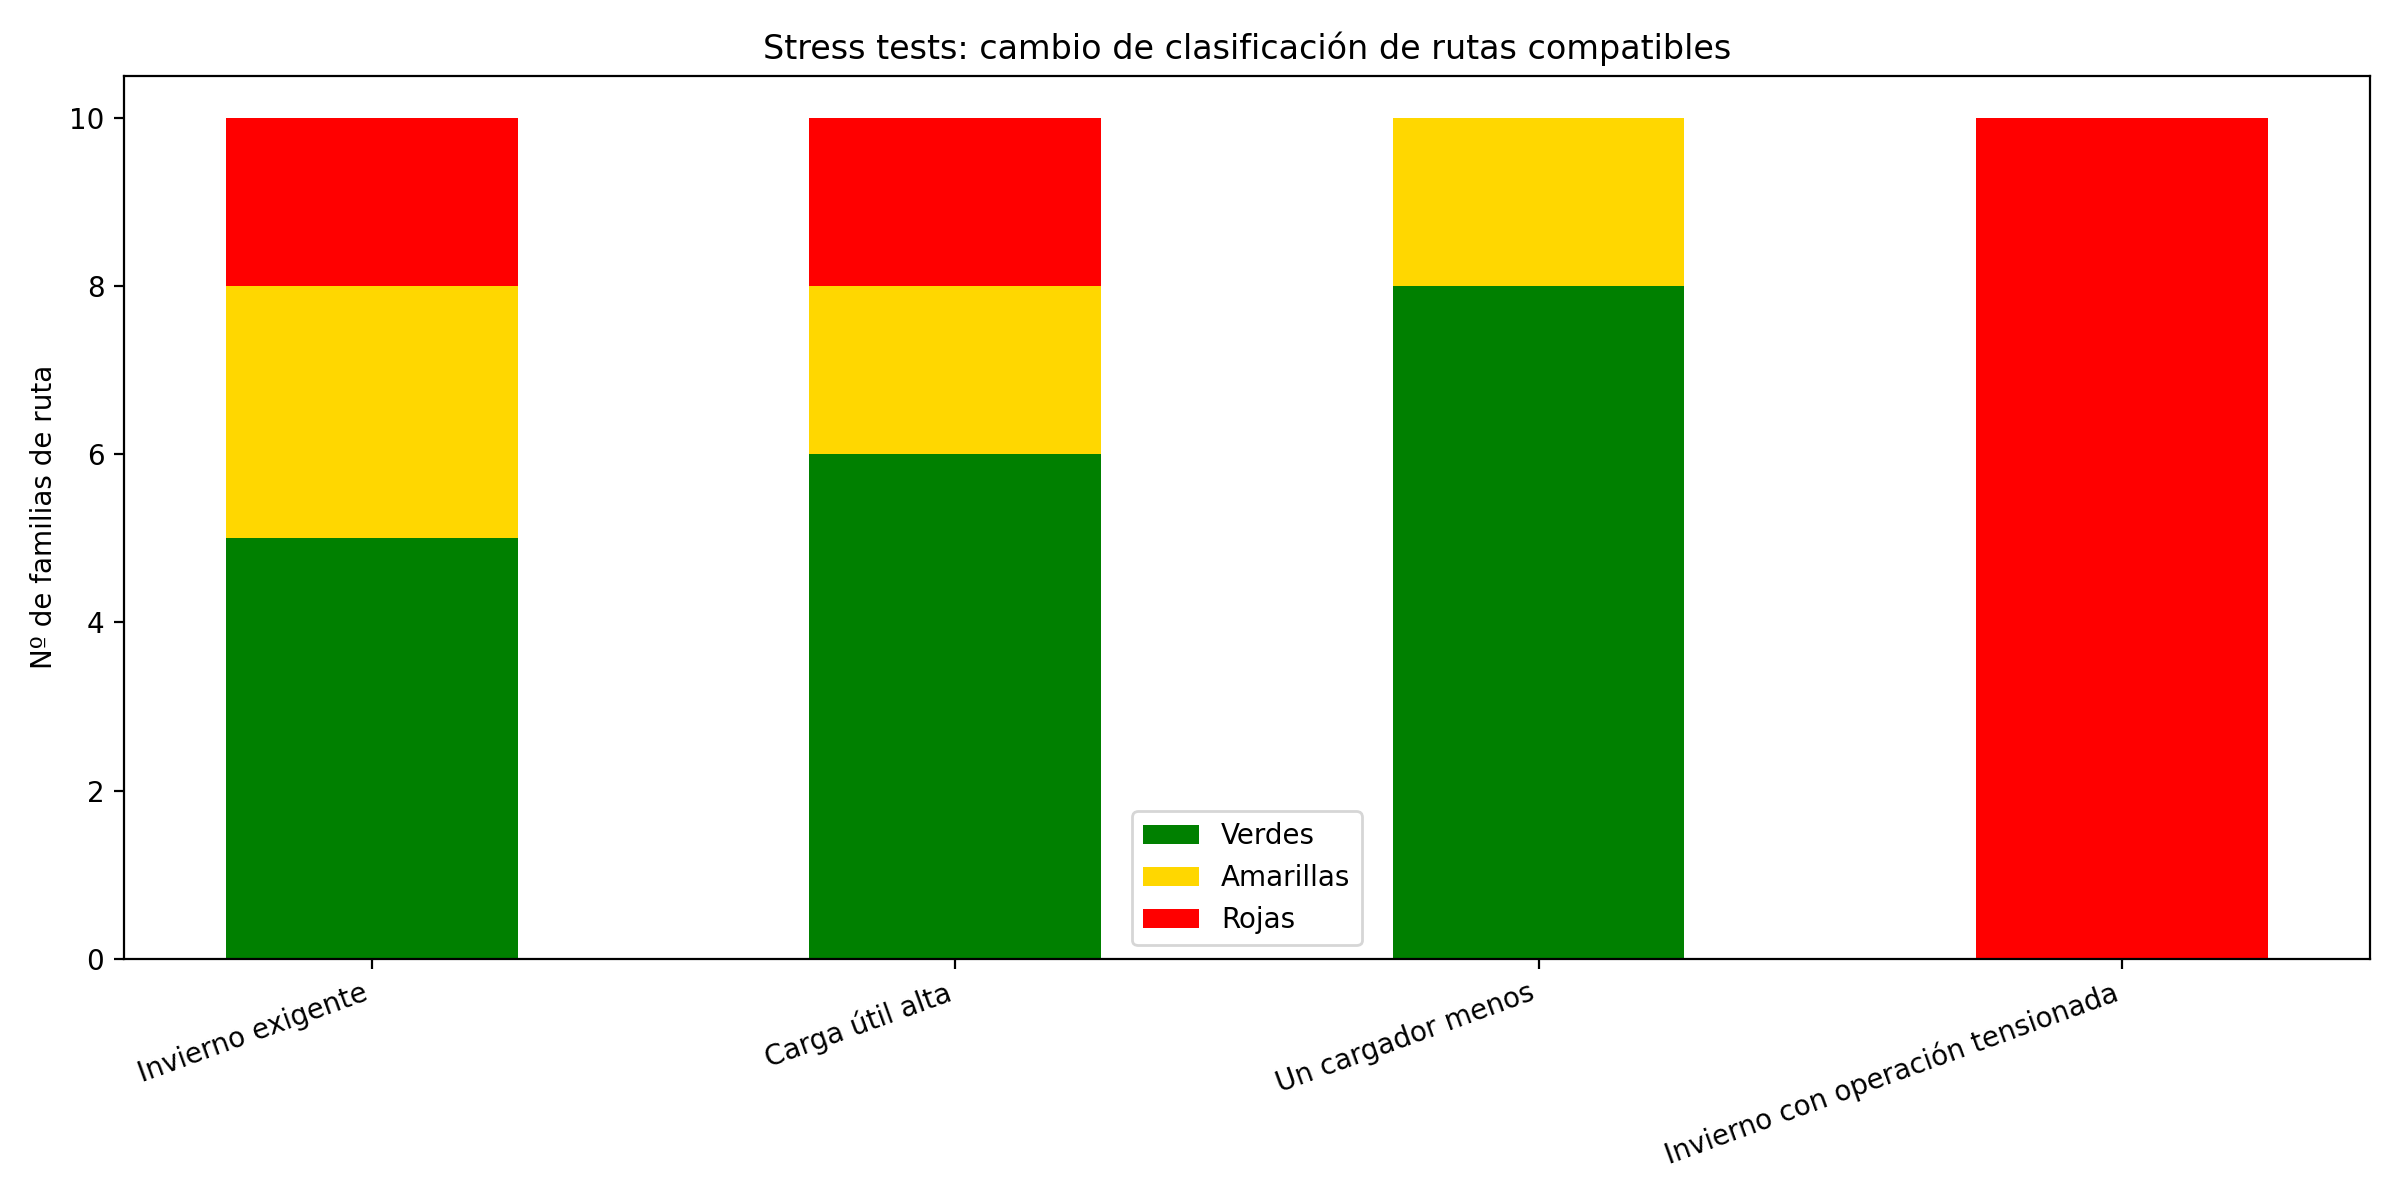
Each scenario exposes a different weakness:
- Demanding winter: several routes lose margin and move from green to yellow or red.
- High payload: some assignments fail because of vehicle capacity, not only energy.
- One charger unavailable: the routes still fit the vehicles, but the depot can no longer sustain the combination.
- Winter with stressed operations: the deployment cannot be presented as resilient without additional rules.
The route-level comparison shows where the loss of margin is concentrated.
| Route | Family | Baseline kWh | Stressed winter kWh | Increase | Baseline band | Stress band | Stress margin km |
|---|---|---|---|---|---|---|---|
| R01 | R01 Dense city centre | 33.68 | 43.42 | 28.9% | green | red | 3.1 |
| R02 | R02 Pharmacy and temperature-controlled | 46.72 | 53.05 | 13.5% | green | green | 37.88 |
| R03 | R03 Northern industrial area | 50.84 | 63.42 | 24.7% | green | yellow | 22.26 |
| R04 | R04 Urgent spare parts west | 71.3 | 87.72 | 23.0% | green | yellow | 15.68 |
| R05 | R05 City-centre HoReCa food delivery | 54.07 | 67.83 | 25.4% | green | yellow | 11.66 |
| R06 | R06 Light parcels outskirts | 54.63 | 67.38 | 23.3% | green | yellow | 14.72 |
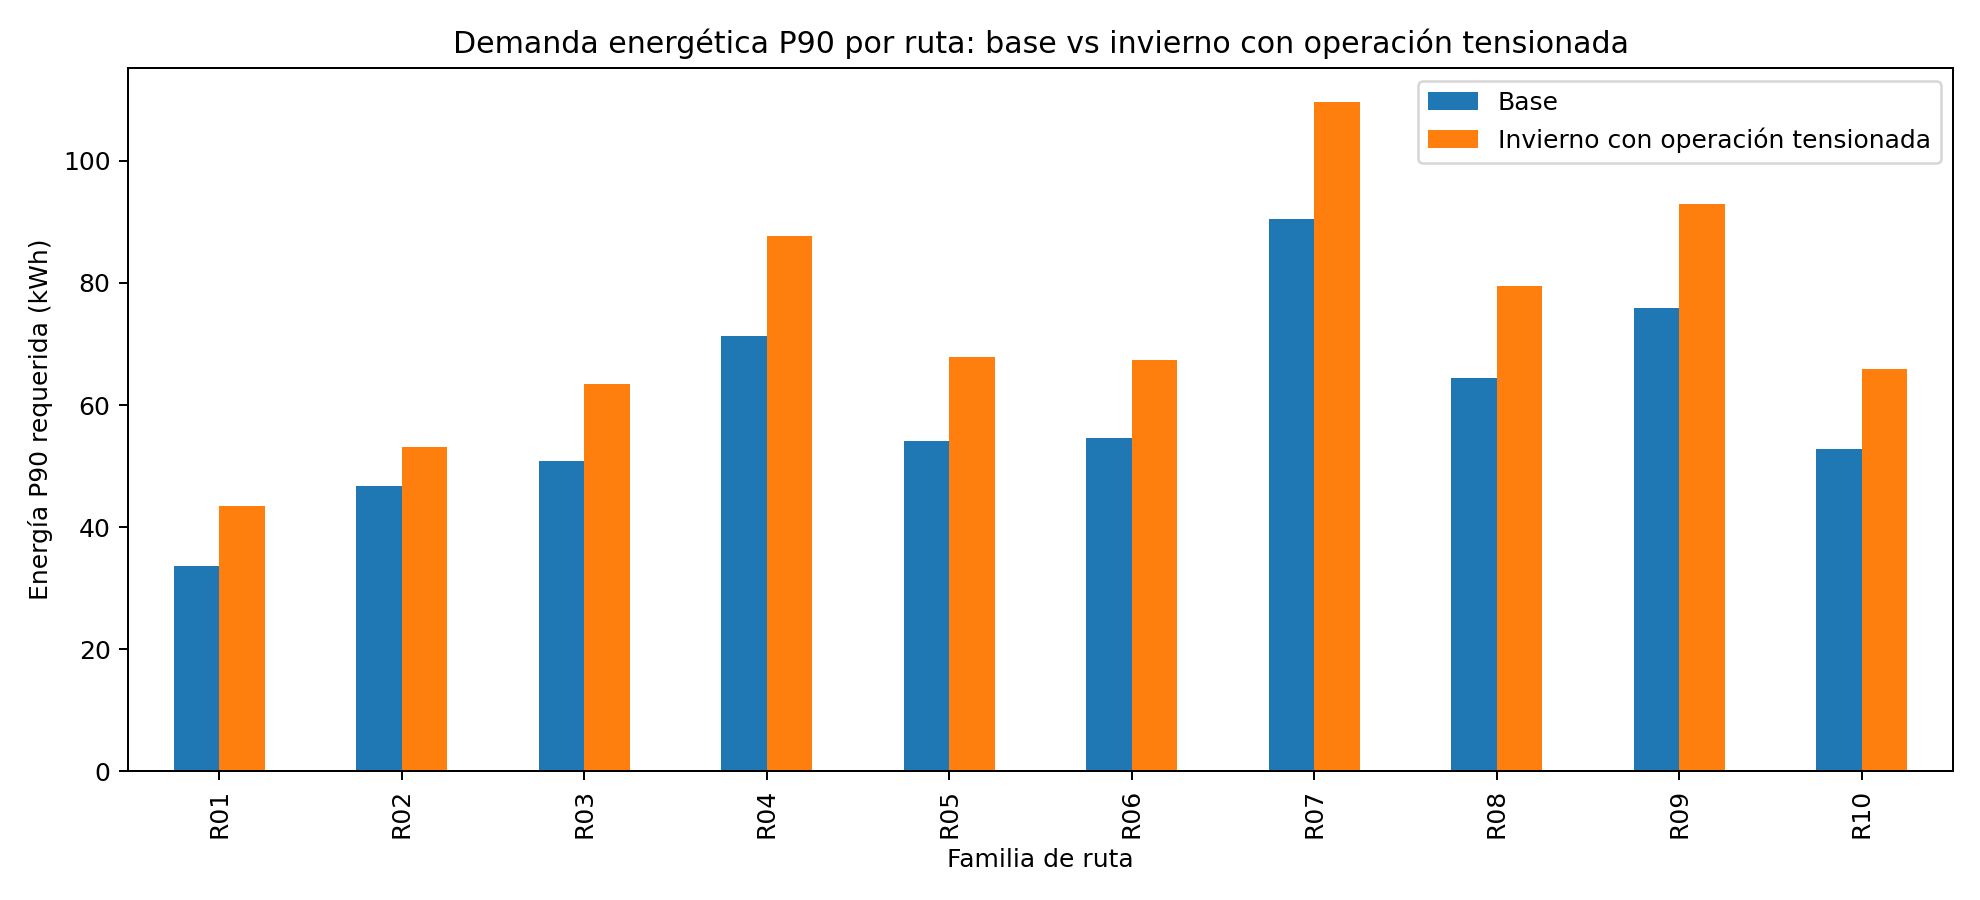
R01 is a useful example. Under baseline conditions it looks like a natural small-van route. Under winter and operating stress, its margin falls to 3.1 km. The route has not become “bad”; it has become too dependent on everything going right.
Recommended decision
Phase 1: six vehicles with explicit rules
The initial routes are R01, R02, R03, R04, R05 and R06.
The deployment should include:
- a route-specific target SOC;
- payload and mileage-deviation monitoring;
- tracking of late returns;
- alerts when a charger does not deliver the expected power;
- diesel substitution when forecast margin falls below the threshold;
- several weeks of validation before expansion.
At 311.24 kWh per night, this phase leaves margin below the depot’s 453.6 kWh deliverable capacity. It is not the maximum phase. It is the defensible one.
Phase 2: expand using pilot data
R09 and R10 could be the next candidates. R07 and R08 need more careful validation because they begin in the yellow band.
Electrifying all ten compatible routes would require about 106.37 kW of contracted power and additional charging capacity. That investment should follow real evidence on consumption, schedules and available margin.
What should not be electrified yet
- R11, long regional high-value route: 236 km P90, substantial motorway use, elevation and a long working day. It should first be split, supported by structured intermediate charging or redesigned around a different architecture.
- R12, heavy refrigerated peri-urban route: high payload, refrigeration, body conversion and 172 km P90. It needs an instrumented trial and route-specific validation.
- R07 and R08 as fixed day-one EV routes: they may enter a controlled pilot, but should not anchor the first deployment.
Daily operation after procurement
Electrification becomes real when the vehicle has to leave the next morning.
| Moment | Operating control |
|---|---|
| Before charging | Confirm routes, forecast energy, vehicle assignment and charger availability |
| During the night | Monitor actual power, failed sessions and priority by departure time |
| Before departure | Compare actual SOC with P90 route energy, payload and minimum reserve |
| After the route | Compare forecast and actual energy, additional distance, return time and deviations |
This loop turns a pilot into learning. Without it, the fleet proves that the vehicles move, but not what is required to scale them.
Why a spreadsheet becomes difficult to maintain
Excel can add distance, energy and cost. The challenge is maintaining all the relationships consistently:
- P50 and P90 distributions by route;
- payload, volume, temperature and road type;
- battery, consumption, charging power and degradation by vehicle;
- contracted power, site load, chargers and overnight window;
- simultaneous route and vehicle allocation;
- scenarios with cold weather, higher payload or equipment failure.
The optimum is not the route with the fewest kilometres. It is the combination of routes and vehicles that creates value without exceeding energy, power, charger and operating-margin limits.
Urban fleet electrification should not begin with “which van should we buy?”. It should begin with which routes can be electrified tomorrow, using which vehicle, charging where and with what margin when conditions become difficult.